Diversity, Equity, and Inclusion at Techstars
Sep 10, 2020
In July and September, we published diversity statistics for our full-time employees and the founders and CEOs who have gone through Techstars accelerator programs (see below).
Now, we are able to share data about our mentors as well. At Techstars, mentors are an essential part of our culture. By freely sharing their wisdom and guidance, they impact the entire network and create real, lasting relationships. It is therefore deeply important that we understand who they are, and work to ensure the diversity of our mentor pool.
Out of over 8500 active mentors, 959 filled out our survey. If you’re a Techstars mentor and did not yet complete it, we urge you to do so. Mentors can email us at diversity.inclusion@techstars.com for the survey.
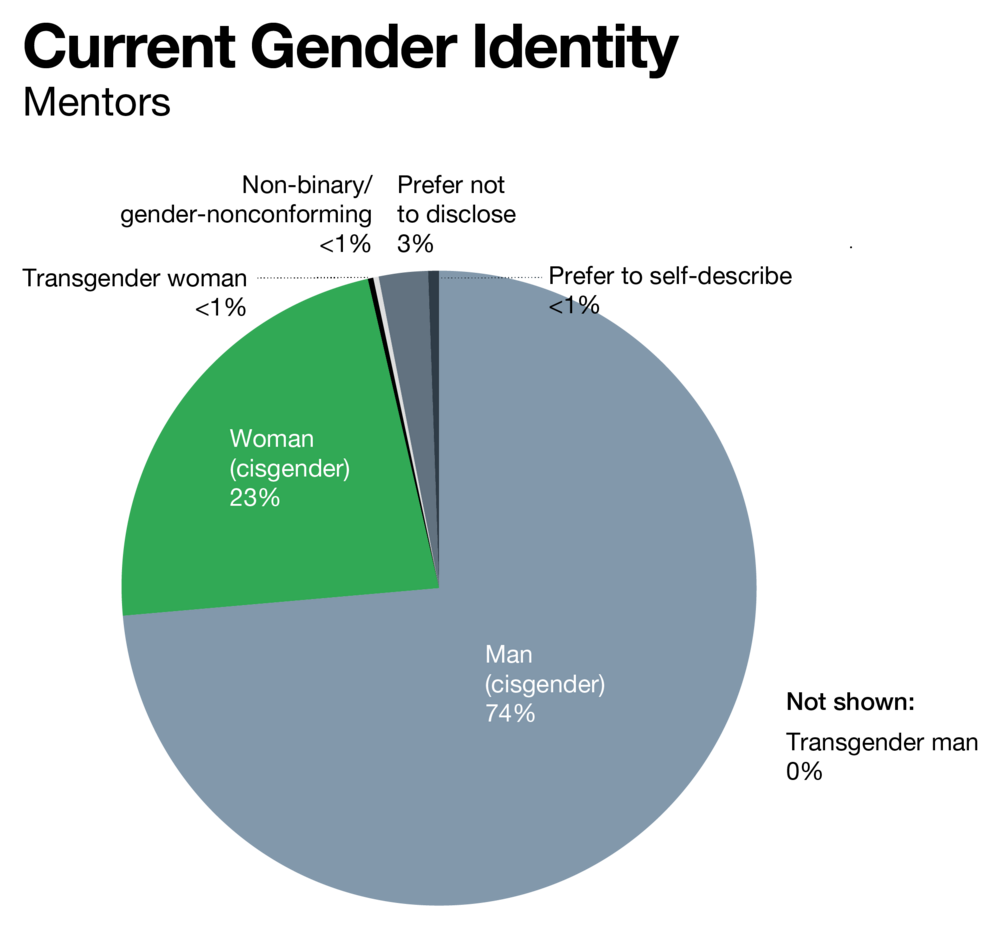
Of these 959 mentors who responded, 74% identified as men, 23% as women, 3% preferred not to disclose, and fewer than 1% identified as transgender men or women, non-binary/gender-nonconforming, or prefer to self-describe.
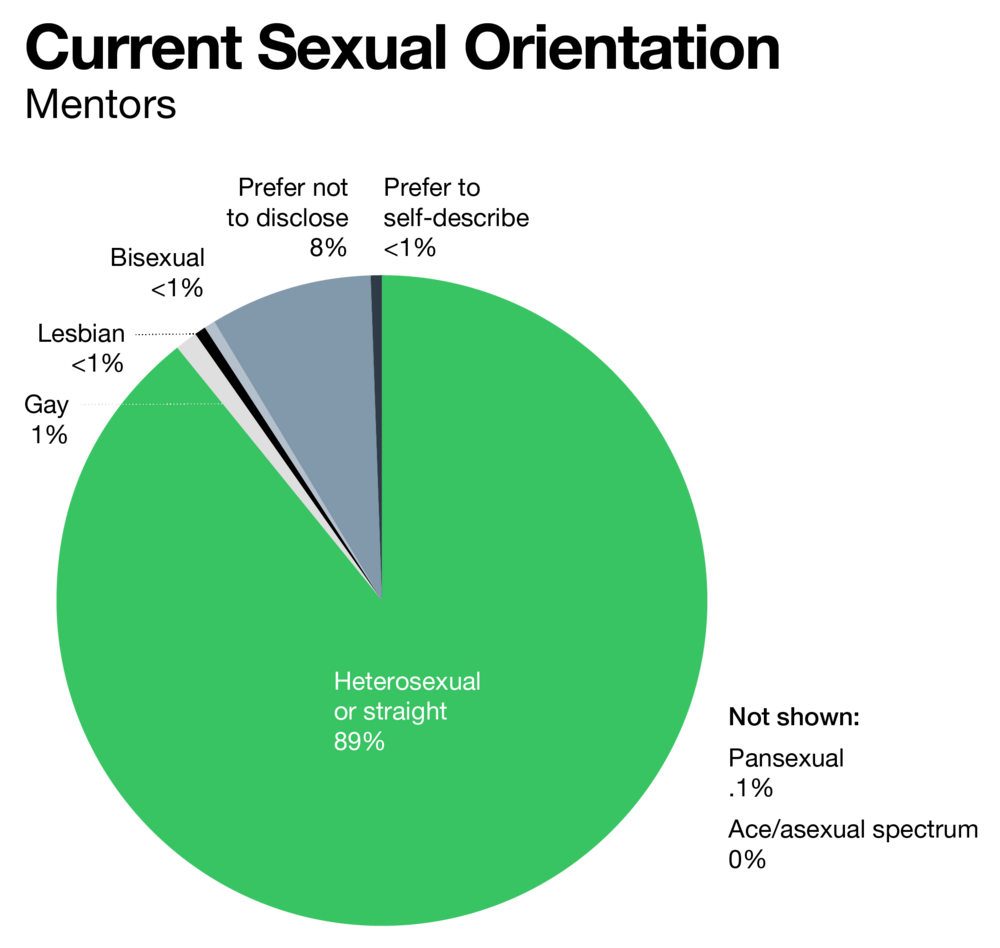
As for their sexual orientation, 89% describe themselves as heterosexual or straight, 1% at gay, about under 1% as lesbian, bisexual, or pansexual. None so far identify as ace/asexual spectrum, but 8% prefer not to disclose, and under 1% prefer to self-describe.
We asked only U.S. mentors to provide their race or ethnicity, so 23% simply told us that they are based outside of the U.S. As for U.S. mentors, 61% identify as white, 9% at Asian, 5% prefer not to answer, 4% identify as Hispanic or Latinx, 4% as Black or African American, 3% as other, 2% as Middle Eastern, 1% as American Indian or Alaska Native, and less than 1% as Native Hawaiian or Other Pacific Islanders.

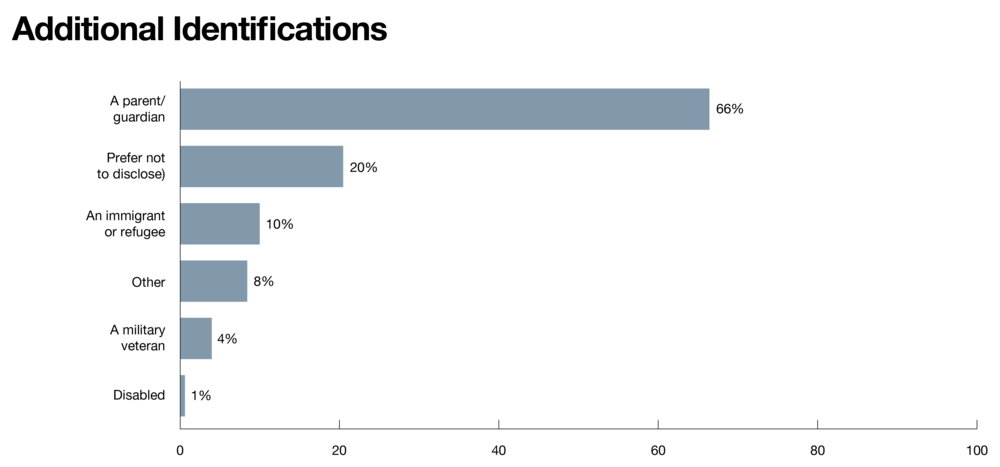
We also asked mentors about other important factors around their identity. A full 66% identify as parents or guardians, 10% as immigrants or refugees, 4% as military veterans, just under 1% as disabled, 9% as “other,” and 20% chose not to disclose.
Updated on September 10, 2020
Update: Diversity Stats on our Founders
This past July, we published diversity stats for our full-time employees. This included Techstars employees performing various functions across the organization as well as Managing Directors and Program Managers at our U.S.-based accelerator programs.
As we published this data, we also re-doubled our efforts to capture and share diversity stats for the thousands of founders and CEOs who have gone through our accelerator programs. In 2016 we increased our effort to collect data, yet still only have an average 70% gender and 40% race & ethnicity data collected.
This year we created a voluntary survey to fill in some of those data gaps and, of the 5400 founders and CEOs, who received it, only 391 completed the survey. If you’re a founder or CEO and did not yet complete it, we urge you to do so, this will allow us to truly get an accurate baseline. Techstars founders can find a link to the survey here.
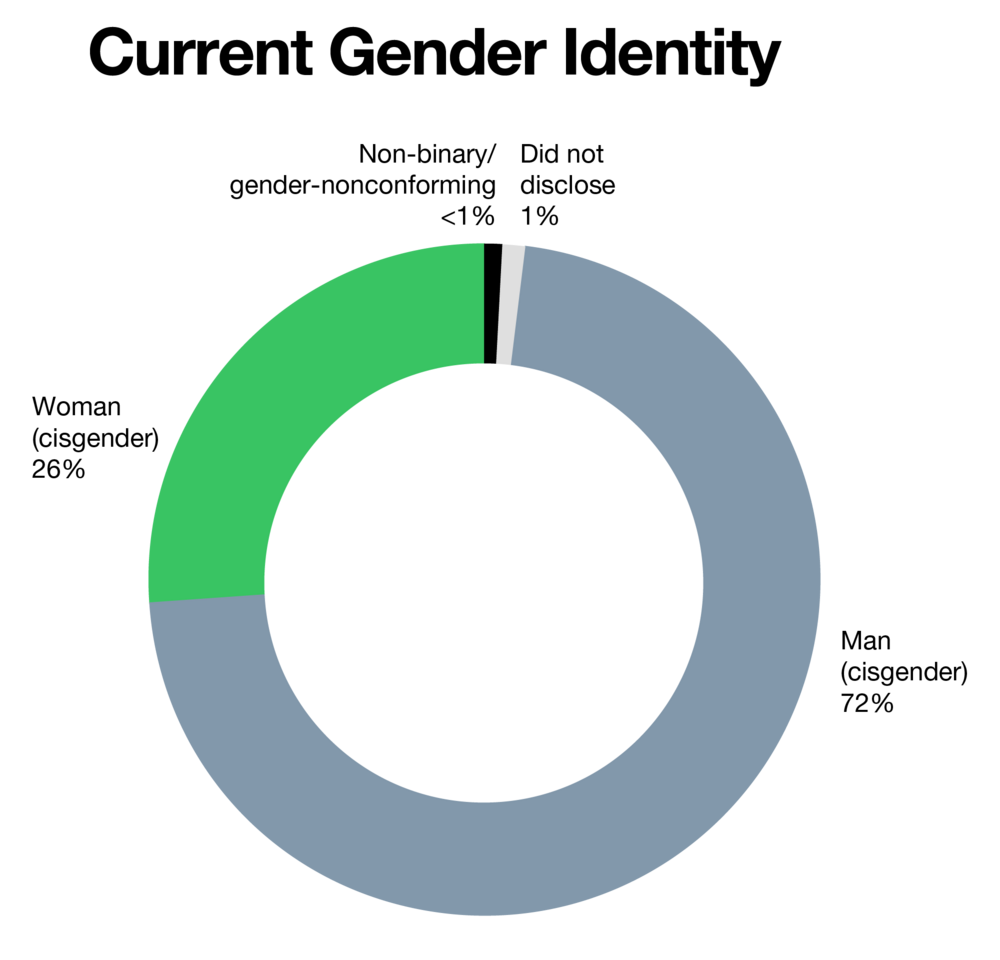
In the spirit of transparency, we want to share the results thus far. Of the 381 founder or CEOs who responded, 72% identified as men (cisgender), 26% identified as women (cisgender), 1% preferred not to disclose and less than 1% identified as Non-binary/ gender-nonconforming.
We also looked at race and ethnicity among our U.S.-based founders and CEOs as well. Of the 300 who responded, 57% identified as White, 14% as Asian, 5% as Middle Eastern, 11% as Black or African American, 6% as Hispanic or Latinx, 2% preferred not to answer, 2% as Other, 1% as American Indian or Alaska Native and 1% as Native Hawaiian or other Pacific Islanders. We also know that diverse founders were more likely to respond, so the data may not be truly representative at this time.

Our data collection journey:
We learned that even with current events and the spotlight on social justice, the response rate for this survey was lower than expected. We noticed that the data skewed higher for diversity compared to our historical data. Our assumption is that individuals who are diverse are more likely to complete these surveys. We are continuing to encourage our founders to submit their survey, but this data is sensitive and has to be optional.
While we are trying to create inclusive questions that allow individuals with different identities to self identity, we will always be open to learning and improving our data collection practices.
Capturing the demographic for our entire global founder network is challenging. How we categorize diversity in the U.S is not the same in other countries. Our team is still working diligently to understand diversity and equity issues per country we work in to customize our demographic questions accordingly.
Moving forward, the diversity data collection process will continually be improved upon and diversity data on founders and CEOS will be included in our bi-annual diversity updates.
Originally published on July 23, 2020
At Techstars, we believe entrepreneurs can change the world. We believe collaboration drives innovation. We believe great ideas can come from anywhere — and, perhaps more pertinent here, from anyone. We also believe that diversity, equity, and inclusion should be reflected in our global network. And, quite frankly, that’s an area where we need to improve.
Since the company’s beginnings in 2006, we put in place initiatives to promote diversity, equity, and inclusion in our hiring, practices, and company culture, at a corporate level as well as in our accelerator and community programs. It’s core to our values and our mission to help all entrepreneurs succeed.
Yet the data in this report clearly reveals the results of that work aren’t yet there. We are committed to improving it.
We recently announced seven commitments focused on improving diversity, equity, and inclusion across the Techstars organization and network. One of those commitments is focused on honestly and transparently reporting our diversity numbers on a regular basis. We will be starting with our staff and will soon report on accelerator and community programs.
Approach
We will be publishing our diversity stats twice each year, in July and January. These reports, always available on this website, will attempt to clearly include definitions and, as we improve our data collection processes, we will look to track and address diversity among portfolio companies and participants at community events, like Startup Week and Startup Weekend.
Where We Are Today
Overall, our diversity numbers reflect a mix of both successes and failures. As of June 25, 2020, the overall global headcount for Techstars stands at 303 employees. This includes full-time employees, our global accelerator programs and our largely remote staff all over the world. This does not include employees at our portfolio companies, volunteers in our community organizations or mentors.
Sex Assigned at Birth at Techstars
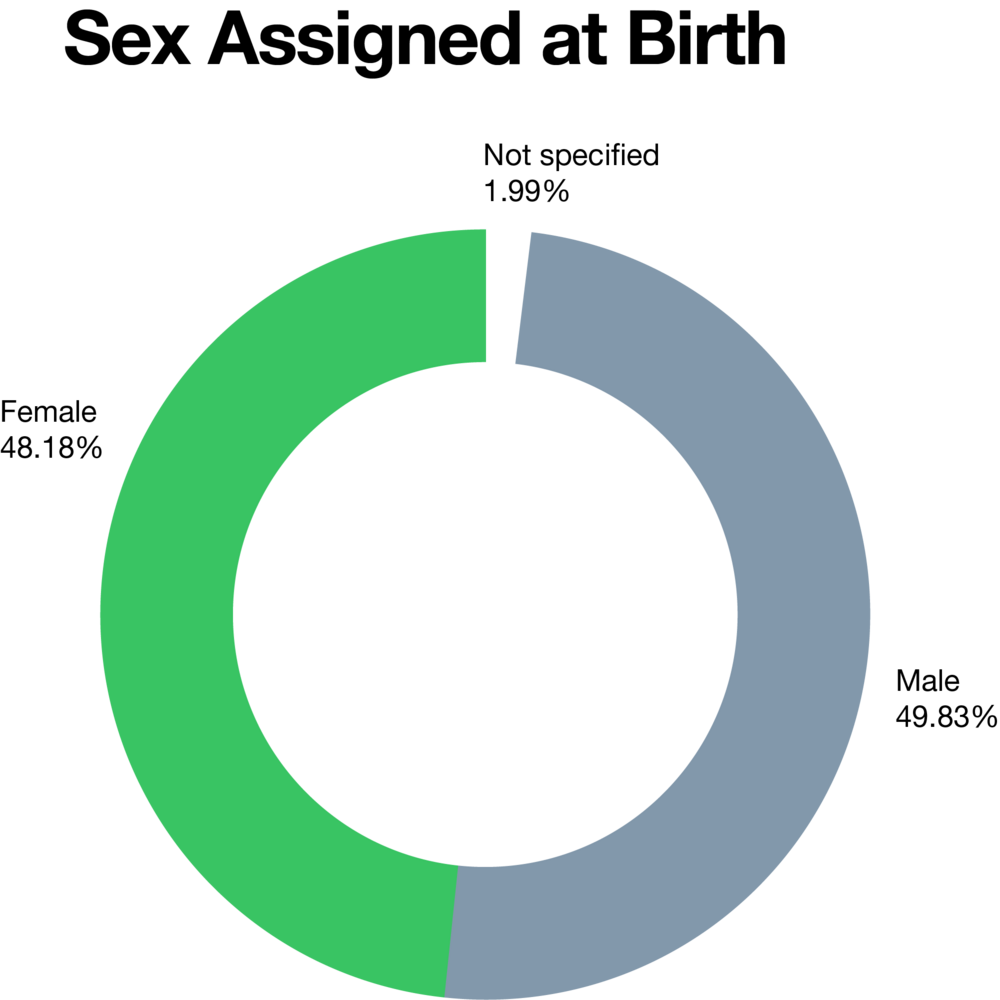
Of our 303 employees, nearly 50% identify as male, 48% as female while 2% do not specify. These numbers reflect a concerted effort to actively recruit and retain more women in an industry that still skews male.
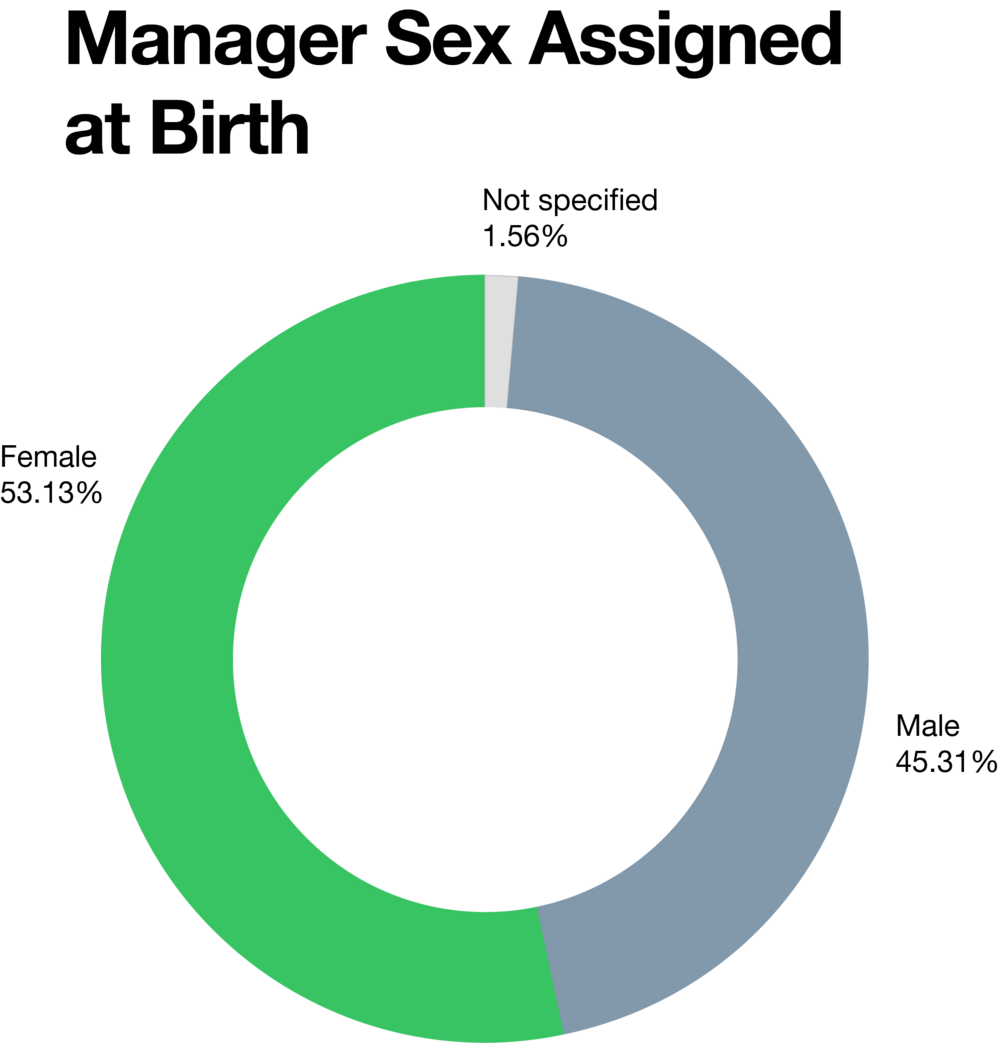
We looked at sex among 64 managers at Techstars. Defined as any employee who oversees at least one other employee, managers identify as 53% female, 45% male with 2% not specifying. This too reflects an effort to empower more women to take leadership roles at Techstars.
Finally, we looked at sex at our accelerator programs. Our mentorship-based accelerator programs are the lifeblood of our company, and, since 2006, we have worked with more than 2,200 portfolio companies. Their impact on young companies can not be overstated.
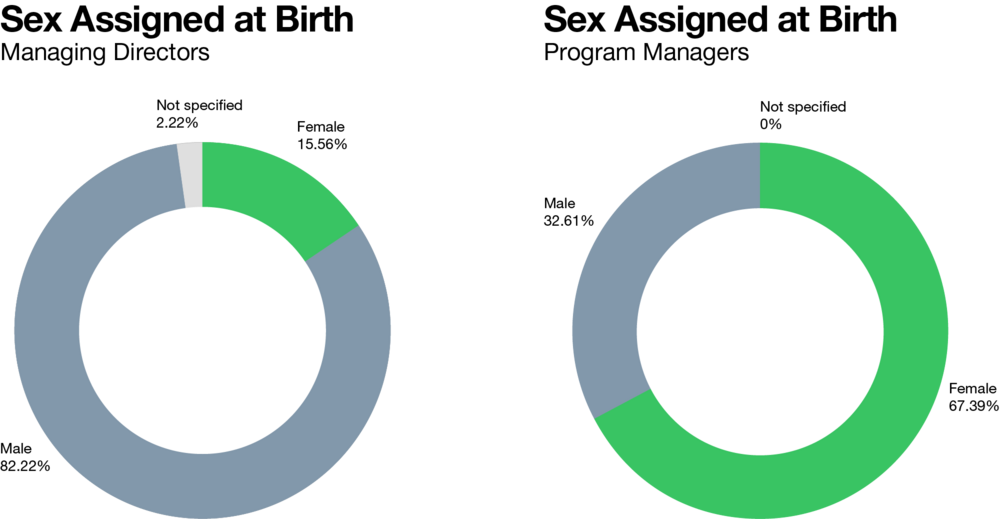
Among 45 managing directors, 82% identify as male, 16% as female, and 2% did not specify.
The numbers were nearly reversed among 46 program managers with 67% identifying as female and 33% identifying as male.
While we’re heartened by such a strong female contingent of program managers, the predominantly male makeup of managing directors remains an area of focus. Evolved recruiting, sourcing, and interviewing practices are already set in place and we fully expect to make inroads in 2021.
Race & Ethnicity at Techstars in the U.S.
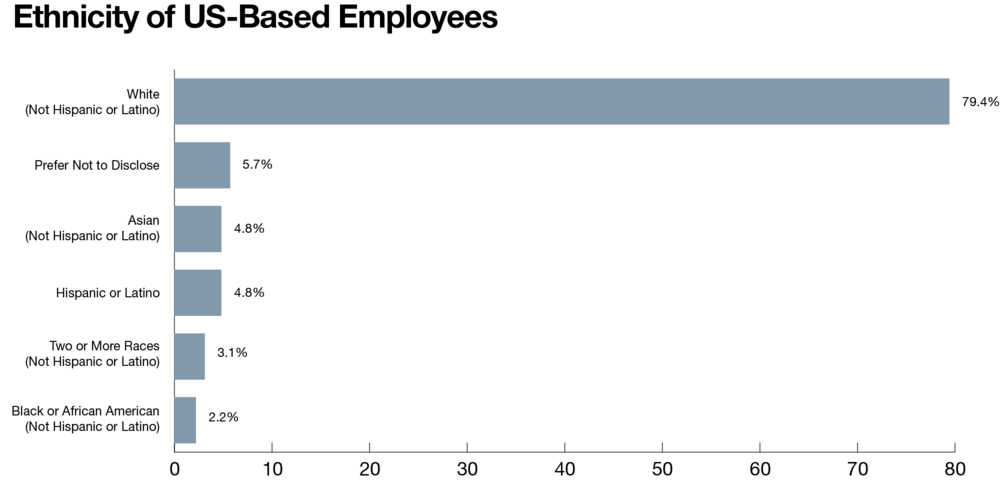
The race and ethnicity numbers in the United States are more concerning. Among our 228 U.S.-based employees, 79% identify as White, 5.7% Prefer Not to Disclose, 4.8% identify as Hispanic or Latino, 4.8% as Asian, 3.1% as Two or More Races, and 2% as Black or African American.
Among our U.S.-based accelerator programs, 83% of our Managing Directors identify as White, 7% as Black or African American, 3% as Asian, 3% as Hispanic or Latino, and 3% as Two or More Races.

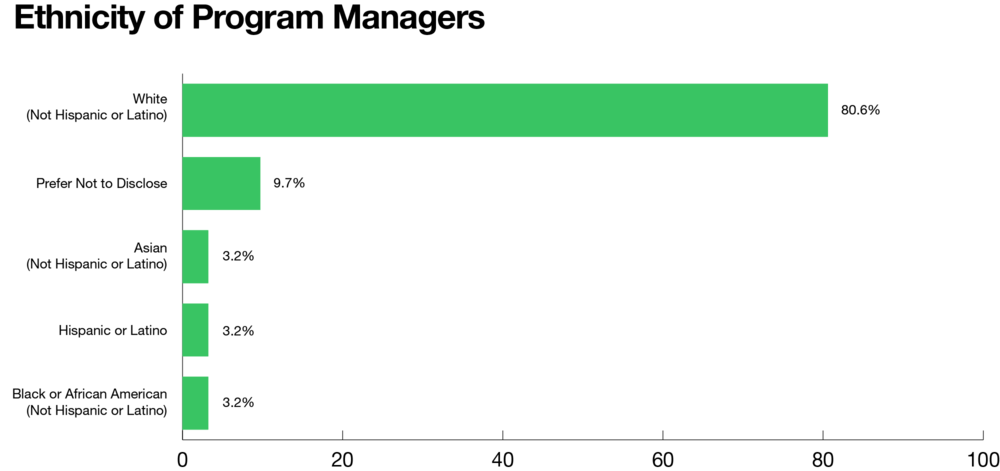
The mix is largely the same among Program Managers. Among U.S.-based Program Managers, 81% identify as White, 10% Prefer Not to Disclose, 3% as Asian, and 3% as Hispanic or Latino. While we have made some progress in recruiting more women as PMs, we have not made much progress in diversifying among race and ethnicity. This remains an area of focus.
Since Race and Ethnicity are informed by cultural definitions, we purposely do not include global numbers as part of this analysis.
A Note on our Source and Next Steps
All data was sourced from Namely, the People Operations platform employed by Techstars. Moving forward, we will supplement this data with a larger company initiative to get a deeper understanding of the companies in our portfolio programs, Techstars mentors, and of participants in community events like Startup Week and Startup Weekend.
